There are multiple scenarios that describe the placement of the VISION Radio Module in relation to the tester’s position and the height of the module. For each scenario, measurements are conducted at two different distances (1m and 15m from the fixture), with the phone always positioned at a height of 1 meter. The following sections provide a detailed description of each scenario, followed by an example illustrating how the signal strength values are measured and recorded in a table.
Reference Measurements were made with iPhone 14 / Ipad.
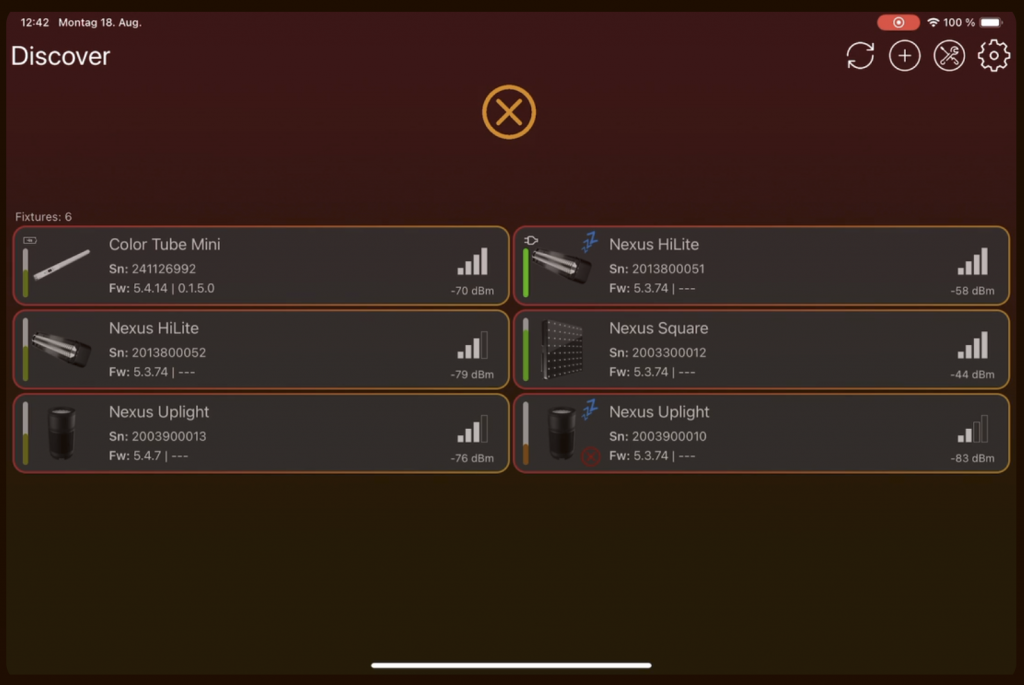
Just scan to get radio signal strength. The signal strength is averaged over every scan received:
Scenario I:
The fixture is placed at a height of 1 meter and is positioned so that the VISION Radio Module faces forward towards the tester.

Scenario II:
The fixture is placed at a height of 1 meter and is positioned so that the VISION Radio Module faces backward, away from the tester.

Scenario III:
The fixture is placed on the floor and is positioned so that the VISION Radio Module faces forward towards the tester.

Scenario IV:
The fixture is placed on the floor and is positioned so that the VISION Radio Module faces backward, away from the tester.

Measurement:
For each scenario and at every distance, approximately five measurements are required. The following table is an example:
| Scenario & Distance | Signal Strength [in dBm] measurement 1 to 5 |
|---|---|
| Scenario I (1m): | -46; -40; -40 ; -40; -37 |
| Scenario I (15m): | -63; -62; -63; -67; -68 |
| Scenario II (1m): | -62; -60; -62; -59; -59 |
| Scenario II (15m): | -73; -72; -72; -72; -69 |
| Scenario III (1m): | -53; -55; -53; -59; -54 |
| Scenario III (15m): | -63; -63; -64; -61; -62 |
| Scenario IV (1m): | -64; -61; -61; -60; -60 |
| Scenario IV (15m): | -71; -69; -68; -71; -72 |
Then calculate the average of the 5 signal strength values for each scenario and distance:
| Scenario & Distance | Average of Signal Strength [in dBm] |
|---|---|
| Scenario I (1m): | ((-46) + (-40) + (-40) + (-40) + (-37) + (-41))/5 ≈ -41 |
| Scenario I (15m): | -65 |
| Scenario II (1m): | -60 |
| Scenario II (15m): | -72 |
| Scenario III (1m): | -55 |
| Scenario III (15m): | -63 |
| Scenario IV (1m): | -61 |
| Scenario IV (15m): | -70 |
Your calculated value should ideally fall within the best case or at least within the acceptable range of the table below. However, if it falls into the bad range, you need to improve your VISION Radio Module by either changing the module, the signal antenna, or adjusting the material of the housing, which might be blocking the signal too strongly.
| Scenario & Distance | Good signal strength | Acceptable signal strength | Bad signal strength |
|---|---|---|---|
| Scenario I (1m): | -20 to -50 dBm | -50 to -60 dBm | -60 to -120 dBm |
| Scenario I (15m): | -20 to -70 dBm | -70 to -80 dBm | -80 to -120 dBm |
| Scenario II (1m): | -20 to -60 dBm | -60 to -70 dBm | -70 to -120 dBm |
| Scenario II (15m): | -20 to -75 dBm | -75 to -80 dBm | -80 to -120 dBm |
| Scenario III (1m): | -20 to -60 dBm | -60 to -70 dBm | -70 to -120 dBm |
| Scenario III (15m): | -20 to -75 dBm | -75 to -80 dBm | -80 to -120 dBm |
| Scenario IV (1m): | -20 to -65 dBm | -65 to -70 dBm | -70 to -120 dBm |
| Scenario IV (15m): | -20 to -75 dBm | -75 to -80 dBm | -80 to -120 dBm |